That leads me to meet stakeholders where they’re at: in Excel. And modern data warehouses like Snowflake make it really easy to do so. It’s an easy win if you’ve invested in Analytics Engineering to create clean datasets in your database. Let’s bring those datasets to your users.
Here’s how to connect Snowflake into Excel and enable live connections pivot tables in minutes. These are instructions for Windows specifically.
Step by Step Instructions
(1) Install the ODBC Driver
Click on the “Help” button in the Snowflake UI, go to “Download…” and select “ODBC Driver” and “Snowflake Repository”. Install from the file that downloads.
(2) Configure ODBC Driver
Go to your start menu and type in “ODBC” and click on ODBC Data Sources (64 bit)
Under User DSN, select Add…
Select SnowflakeDSIIDriver from the menu
Fill in the boxes as follows – though your individual situation may vary. My example uses SSO when an organization doesn’t allow direct usernames/passwords for Snowflake. Lots of options here and Snowflake has full documentation of options here.
Note: I found that lots of databases & schemas are available even after choosing some here. Not sure the full limitations, so you can play with options. I put all options in for the primary database I cared about and it worked fine.
Click on Test… to confirm it worked. Here’s the dialog if it did:
(3) Connect to database in Excel
Open Excel and go to the Data tab, click on Get Data and choose From Other Sources and pick From ODBC
From the window that pops up, pick the Snowflake connection and select OK
If successful, you’ll see a window with a dropdown showing your available databases. Use that dropdown to pick the database you want.
IMPORTANT: There is an easy way to load data directly into a Pivot Table at this point (thanks Jacob for this tip!) which will save you and teams time.
Once you select the database / schema / table you want, go to that “Load” button on the bottom and click the little down arrow next to it. Choose “Load to…”
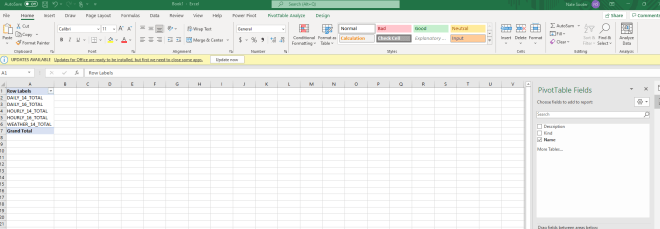
The next menu that pops up will give you various options – pick the second one down saying PivotTable Report
DONE. You’re there. The data is now connected live to Snowflake and is available to pivot. I used Snowflake’s sample “Weather” table which I just learned has basically nothing in it, but that’s besides the point.
Parting notes
There are a couple interesting tidbits to pass both to your stakeholders as well as anyone concerned about Snowflake compute cost & data security.
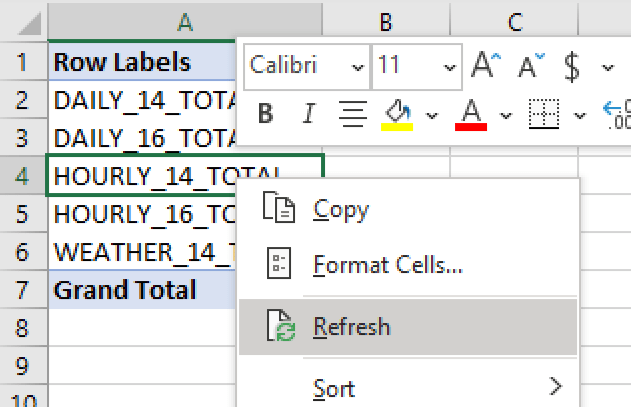
(1)Stakeholders can refresh data live from Snowflake any time. By right-clicking the pivot table and selecting “Refresh”. No more stakeholders asking you for the latest data – they can just get it anytime.
(2) Data is cached on the local machine, reducing compute costs & keeping things snappy for stakeholders. This satisfies worries from both stakeholders on performance (it’s REALLY snappy, even for huge tables) as well as those concerned on cost (compute only happens on refresh).
That’s it! Just a few installations and clicks and you’ve connected Snowflake live into Excel for any stakeholder. Happy self-serving.
Like most people, I’ve been obsessed with Wordle for the past few weeks. It’s been a fun diversion and the perfect thing to do while sipping a cup of coffee.
But of course, my brain is somewhat broken by SQL and when I saw this GitHub repo courtesy of Derek Visch, I was intrigued by the idea of using SQL to build a Wordle optimizer.
Using his existing queries, I was able to get a list of “optimal” first words. But it took forever! On my laptop, over 900 seconds. Surely this thing could be optimized.
the first dbt run of the query
For reference, you can find the query here, but I’ve pulled a point in time copy below.
{{ config( tags=["old"] ) }}

WITH guesses as (
      SELECT
            word,
            SUBSTRING(word, 1, 1) letter_one,
            SUBSTRING(word, 2, 1) letter_two,
            SUBSTRING(word, 3, 1) letter_three,
            SUBSTRING(word, 4, 1) letter_four,
            SUBSTRING(word, 5, 1) letter_five
      FROM {{ ref( 'wordle' ) }} ),
answers as (
      select
            word,
            SUBSTRING(word, 1, 1) letter_one,
            SUBSTRING(word, 2, 1) letter_two,
            SUBSTRING(word, 3, 1) letter_three,
            SUBSTRING(word, 4, 1) letter_four,
            SUBSTRING(word, 5, 1) letter_five
      from {{ ref( 'answer' ) }} ),
crossjoin as (
      select
            guesses.word as guess,
            answers.word as answer,
            CASE
                  WHEN answers.letter_one in (guesses.letter_one, guesses.letter_two, guesses.letter_three, guesses.letter_four, guesses.letter_five)   THEN 1
                  ELSE 0
            end as a1_match,
            CASE
                  WHEN answers.letter_two in (guesses.letter_one, guesses.letter_two, guesses.letter_three, guesses.letter_four, guesses.letter_five)   THEN 1
                  ELSE 0
            end as a2_match,
            CASE
                  WHEN answers.letter_three in (guesses.letter_one, guesses.letter_two, guesses.letter_three, guesses.letter_four, guesses.letter_five)   THEN 1
                  ELSE 0
            end as a3_match,
            CASE
                  WHEN answers.letter_four in (guesses.letter_one, guesses.letter_two, guesses.letter_three, guesses.letter_four, guesses.letter_five)   THEN 1
                  ELSE 0
            end as a4_match,
            CASE
                  WHEN answers.letter_five in (guesses.letter_one, guesses.letter_two, guesses.letter_three, guesses.letter_four, guesses.letter_five)   THEN 1
                  ELSE 0
            end as a5_match
      from guesses
      cross join answers),
count_answers as (
      select
            guess,
            answer,
            a1_match + a2_match + a3_match + a4_match + a5_match as total
      from crossjoin),
maths_agg as (
      select
            guess,
            sum(total),
            avg(total) avg,
            stddev(total),
            max(total),
            min(total)
      from count_answers
      group by guess
      order by avg desc ),
final as (
      select *
      from maths_agg )

select *
from final
The first optimization
The first, most obvious lever to pull on was to increase compute! So I switched to my newly built gaming PC. The environment setup is win 11 pro , dbt 1.0.0, and postgres 14 (via WSL2), running on an AMD 5600G processor with 32GB of RAM, although WSL2 only has access to 8GB of RAM. I will detail the environment setup in another post.
With this increased compute, I was able to reduce run time by 3.4x, from 927s to 272s.
getting faster
The second optimization
The next level was inspecting the query itself and understand where potential bottlenecks could be. There are a couple ways to do this, one of which is using the query planner. In this case, I didn’t do that because I don’t know how to use the postgresql query planner – mostly I’ve used SQL Server so I’m a bit out of my element here.
So I took each CTE apart and made them into views & tables depending complexity. Simple queries that are light on math can be materialized as views, where as more complex, math intensive queries can be materialized as tables. I leveraged the dbt config block in the specific queries I wanted to materialize as tables.
one query, now multiple models + 1 DAG
Simply by strategically using the table materialization, we can increase performance by 9.0x – 272s to 30s.
much better
The third optimization
Visually inspecting the query further, the crossjoin model is particularly nasty as a CTE.
crossjoin as (
      select
            guesses.word as guess,
            answers.word as answer,
            CASE
                  WHEN answers.letter_one in (guesses.letter_one, guesses.letter_two, guesses.letter_three, guesses.letter_four, guesses.letter_five)   THEN 1
                  ELSE 0
            end as a1_match,

...

      from guesses
      cross join answers
First, there is a fair bit of math on each row. Secondarily, its cross joining a couple large tables and creating a 30m row model. So in round numbers, there are 5 calculations for “guess” times 5 calculations for each “answer”, for 25 calculations per row. Multiply by 25m rows, you get 750m calculations.
Now since I have a pretty robust PC with 6 cores, why not run the dbt project on 6 threads? First things first – lets change our profile to run on 6 threads.
increase thread count to 6!
With that done, I had to partition my biggest table, crossjoin, into blocks that could be processed in parallel. I did this with the following code block:
{{ config(
 tags=["new","opt"],
 materialized="table"
 ) }}

-- Since I have 6 threads, I am creating 6 partitions

SELECT 1 as partition_key, 1 as "start", MAX(id) * 0.167 as "end"
FROM {{ ref( 'guesses_with_id' ) }}
UNION ALL
SELECT 2 as partition_key, MAX(id) * 0.167+1 as "start", MAX(id) * 0.333 as "end"
FROM {{ ref( 'guesses_with_id' ) }}
UNION ALL
SELECT 3 as partition_key, MAX(id) * 0.333+1 as "start", MAX(id) * 0.5 as "end"
FROM {{ ref( 'guesses_with_id' ) }}
UNION ALL
SELECT 4 as partition_key, MAX(id) * 0.5+1 as "start", MAX(id) * 0.667 as "end"
FROM {{ ref( 'guesses_with_id' ) }}
UNION ALL
SELECT 5 as partition_key, MAX(id) * 0.667+1 as "start", MAX(id) *0.833 as "end"
FROM {{ ref( 'guesses_with_id' ) }}
UNION ALL
SELECT 6 as partition_key, MAX(id) * 0.833+1 as "start", MAX(id) as "end"
FROM {{ ref( 'guesses_with_id' ) }}
dag-tastic!
Then I split my table generation query into 6 parts. I believe this could probably be done with a macro in dbt? But I am not sure, so I did this by hand.
select
guesses.word as guess,
answers.word as answer,

...

from {{ ref( 'guesses_with_id' ) }} guesses
join {{ ref( 'guess_partition' ) }} guess_partition ON partition_key = 1
      AND guesses.id BETWEEN guess_partition.start AND guess_partition.end
cross join  {{ ref( 'answers' ) }} answers
Then of course, I need a view that sits on top of the 6 blocks and combines them into a single pane for analysis. The resulting query chain looks like this.
I then executed my new code. You can see in htop how all 6 threads are active on Postgres while these queries execute.
why shouldn’t I use all 6 cores?
This results in a run time of 17.2s, a 53.8x improvement from the original query on my laptop and a 15.8x improvement on the initial query on the faster pc. Interestingly, going from 1 thread to 6 threads only gave us a 50% performance increase, so there were bottlenecks elsewhere (Bus? Ram? I am not an expert in these things).
17 seconds! pretty good
Real world applications
This optimization, taken as a whole, worked for a few reasons:
It’s trivial to add more compute to a problem, although there is real hard costs incurred.
The most common SQL optimization strategy I see is "increase the Snowflake warehouse size"
The postgresql query planner was particularly inefficient in handling these CTEs – most likely calculating the same data multiple times. Materializing data as a table prevents these duplicative calculations.
Databases are great at running queries in parallel.
These exact optimization steps won’t work for every table, especially if the calculations are not discrete on a row-by-row basis. Since each calculation in core table “crossjoin” is row-based, partitioning it into pieces that can run in parallel is very effective.
Some constraints to consider when optimizing with parallelization:
Read/Write throughput maximums
Holding the relevant data in memory
Compute tx per second
This scenario is purely bottlenecked on compute – so optimizing for less compute in bulk (and then secondarily, more compute in parallel) did not hit local maximums for memory and read/write speeds. As noted above, running the threads in parallel did hit a bottleneck somewhere but I am not sure where.
If you want to try this for yourself, you can find the GitHub project here. It is built for Postgres + dbt-core 1.0.0, so can’t guarantee it works in other environments.
Hat tip to Derek for sparking my curiosity and putting his code out there so that I could use it.
PS – The best two-word combo I could come up using this code is: EARLS + TONIC.
I gave a talk last week about “Data to Dashboard” and I wanted to share it here, too. There is a lot of discussion in the analytics space about dashboards and how to make them look good but less about how to get to that point. This is my take on the subject – I hope you enjoy it.
Up to this point, I’ve largely written for those looking to break into an analytics career. Today I’ll go beyond that and discuss the most powerful lesson I and many others learned — something I wish I fully understood starting out:
Start your analytics project as simple as possible and iterate from there.
This strategy borrows a lot from Agile software development not because I’m a student of it, but because I learned the values of Agile through trial and error. Only after I stumbled upon this strategy did I learn how closely it aligns to the Agile methodology.
The Common Mistake
I’m going to assume you’ve already solved the toughest issue in analytics: identifying an ambiguous problem. Congrats! Now you need to figure out how to make it happen. This is where things can go wrong.
Many analysts (myself included!) are then tempted to:
Retreat to your office
Gather & clean all the data you think everyone needs
Build the World’s Best V1 Dashboard
Schedule a meeting to present the dashboard
Receive unanimous praise for how amazing it is
Watch as everyone uses your dashboard daily
What really happens:
Retreat to your office
Gather & clean only some of the data people need
Spend way too long building the Dashboard No One Really Wanted
Stakeholders email you intermittently asking if you’re making progress
Schedule a meeting to present the dashboard
Entire meeting spent fielding questions like “Why don’t I see X or Y?”
Get the cold sweats realizing you don’t have what they need
Stakeholders frustrated that so much dev time was wasted
You’re frustrated that they are “changing what they need”
Retreat to your office
Why Does This Happen?
Every data analyst/scientist makes this mistake. It will continually happen throughout your career, even after you think you’ll never make that mistake again. No one is immune.
There is one core reason why this happens: You assume you understand what the stakeholder wants.
Except you likely don’t. Especially when you’re early in your career. You’ll think you’re on the same page with your stakeholder, but you aren’t. You think you know what data points the stakeholder needs, but you don’t (hint: the stakeholder likely doesn’t know either!). You think you know what kind of visuals the stakeholder will find most useful, but you don’t.
In fact, it’s so difficult to get everything right the first time, you should assume you don’t fully understand the request. That one time you actually do build “The World’s Best V1 Dashboard”, celebrate the unexpected success – it won’t happen often.
Strategy: Start Simple
There’s a solution to this problem: Start your analytics projects as simple as possible. This results in less wasted time in development and happier stakeholders at the end. The process looks like this:
Agree with stakeholder on an MVP (Minimum Viable Product) – something small that can be done quickly
Your stakeholder may not know exactly what they want, so you may have lots of freedom here
Gather & clean only the data you need for the MVP
Create MVP dashboard
Ask your stakeholder questions here, too! You don’t need to go radio silent and many times they’ll appreciate the feedback loop
Present MVP dashboard to stakeholder
Gather feedback from stakeholder
Start process over again
This process is designed to be quick, with small iterations should building on each other until everyone agrees the dashboard fits the needs of the business. The more interactions with stakeholders the better – you’ll quickly identify misalignments, missing data, new requirements, changing business needs and more.
The advantages should be clear. Stakeholders will feel ownership over a product they helped develop (leading to better adoption!). The end product will be closer to what the business needs (leading to better adoption!). And stakeholders will remember the success of the project and give you a call for the next one.
Conclusion
Don’t try to build Rome in a day on any analytics project. You’ll rarely succeed. Instead, iterate and build on a project until it becomes something useful – and likely looks nothing like what you thought it would starting out.
Analytics is a dynamic field. Don’t fight upstream with how quickly things change; set up your work process to allow for quick changes. Your company & future self will thank you.
I think Nate really said it best with “Technical ability is overrated.” When I’m looking to make a hire as a manager, there are four skills that I’m looking for when I’m interviewing and continually assessing for my reports.
Curiosity – a childlike ability to keep asking, “Why?”
Accuracy – balancing perfect vs. “close enough” for your data
Organization – ability to break down tasks into small chunks and reliability execute on them
Empathy – actively listening & seeking to understand, and communication centered on your audience
I’ll breakdown each of these with characteristics with an example, an interview question testing for that skill, and a way that you can improve in each of these areas.
Curiosity
The first soft-skill to have in your repertoire is Curiosity. This often means you are always asking questions and aren’t afraid of asking them. I find myself often hedging a bit in this area by saying something like, “Sorry to be dense about this, but can you explain?”
When I’m dealing with new subject areas, this often will mean pausing conversations to understand words and what they mean. “Net Sales” often means something different in the sales organization vs. the finance organization, so getting to certainty on terms is critical. Frequently, digging into these types of questions can get uncomfortable, especially if the person asking you for help doesn’t know the answer or can’t define it well.
In interviews, there are a couple of ways to get at this skill. One way is to probe about problem-solving: identifying and solving tough problems. This is a bit open-ended, so making sure to redirect the question to your underlying objective is advised. Another way would be to model the behavior and assess how the candidate handles it. A curious person should be able to match your energy and get excited at the premise of jumping down the rabbit hole on a specific subject.
Not everyone comes by this skill intuitively, and for those of you in that bucket, there are some great frameworks to unlock a curious mind. My favorite comes from Sakichi Toyoda, of Toyota fame, and is called the “5 Whys”. More on this below, from Wikipedia.
The key is to encourage the trouble-shooter to avoid assumptions and logic traps and instead trace the chain of causality in direct increments from the effect through any layers of abstraction to a root cause that still has some connection to the original problem.
https://en.wikipedia.org/wiki/Five_whys
Accuracy
Up next, we have accuracy. As a data analyst, it is critical to be right an overwhelming majority of the time. You don’t need to be perfect, and in fact, perfect is the enemy of good. This can be tricky to do well because, as an analyst, you usually are the least knowledgeable person in the domain of the problem at hand. Getting accurate goes hand-in-hand with Curiosity because you must constantly bring assumptions to light. There is a lot of digging to do.
One particularly thorny problem to deal with is sales data within a CRM. It is highly speculative. It changes frequently. In short, it is unreliable. I have found working with this type of data greatly benefits from a common snapshotting period. Just take a backup every Friday at 5 pm. Do your analysis on a static copy, and figure out how to surface changes to key data fields (like close date or opportunity size). This allows you to bring accuracy to constantly shifting data sets.
Part-and-parcel with my comment above, in interviews, I like to probe around “soft data” and see how the prospective analyst has added certainty when data is vague or unreliable. For analysts with finance experience, asking questions about how they dealt with financial periods and month-end processes since those can bottleneck key metrics (like revenue). In that same vein, asking how, in detail, key metrics were calculated will shed some light on their accuracy approach.
Part of why I favor people with accounting backgrounds coming into analytics roles is that accuracy comes with the package. This learned through long hours of grinding out Excel spreadsheets and cross footing numbers one, two, three times. Thankfully, there some tricks to getting better at Accuracy, and it comes along with Curiosity. My favorite is applying a simple checksum technique and ensuring my source & target are equal on an aggregate basis. If it’s wrong – take time to dig into why and understand why what you thought was correct isn’t. The second trick is a checklist, especially for common tasks (say, deploying code to production). Taking time to document exactly how something is done not only reduces the cognitive load for the next time but improves the quality of your work.
Organization
To me, being organized is not about a tidy desk. It is about being to tackle a problem from beginning to end. It means being able to cut through ambiguity and deliver something excellent. An underrated thing about being organized is the skill of breaking down big, hairy problems into small, actionable next steps. To me, an organized person always knows what to do next.
One example where I think Organization comes into play is the meetings you take with your stakeholders. I always try to make sure to recap actions at the end, as a habit to do every meeting that I am in. If I have actions, I’ll write them down but leave others to track their own action.
In an interview, I’ll test for this skill by probing about systems of work. “How do you organize yourself?” or “How do you know what to do next?” are questions that can get to the heart of this. For an analyst, this “system of work” is at the heart of getting more interesting work. Shipping early and often is critical to getting into the more interesting bits of work, so building your own work system is critical.
Getting better at Organization can come in many forms, but looking back on my career, this didn’t come naturally to me. I recall missing a key deadline for some sales analysis for my CSMO. He asked me why I didn’t have what he needed, and I replied, “I was busy.” His response, which put the fear of God into me, was “we are all busy” as he rolled his eyes. Needless to say, I went and picked up David Allen’s Getting Things Done. If you don’t have a work system, GTD is a great starting point, and I still use bits & pieces every day.
Empathy
You want to seek to understand and always bring empathy to the conversation with your stakeholders. They are taking the time to teach you about their business and its problems, so be a respectful skeptic. Remember, you want these folks to back to you the next time they have a problem! Empathy also means centering your communication on your stakeholders, so they feel heard even when you are giving bad news.
One thing I did as I got more comfortable in my analyst role was “rounding” with key stakeholders. This would mean making space to get coffee, drop-in late afternoon as things are winding down, and occasional lunches. These conversations were often more personal than business, but by the time conversation turned to work, we were both comfortable and ready to listen to each other. At one point, I had a couch in my office, and we joked that people would come by for therapy1.
Testing for empathy in an interview is a bit of a challenge. For me, I try to observe if they are listening versus waiting for their time to speak. I can go on for a bit too long at times, so when I catch myself wandering, I also casually check for body language in the candidate to see if they are really listening. Ultimately, this is one of the hardest skills to judge in an interview for me. But I’m actively trying to find ways to measure this quickly and accurately.
As an analyst, you are pretty sharp and usually have a good idea of how to solve a problem as soon as you hear it. To be more empathetic, slow down. Fall in love with the problem. You need to see the problem clearly enough that you can come up with a solution that exceeds your stakeholder’s expectations. Repeat back what you think you heard. This is especially important if the person across the table from you is from a different background, as cultural context can get in the way of great communication. People should always leave a meeting with you feeling like they were listened to.
Final Notes
With Curiosity, Accuracy, Organization, & Empathy, you can be a great analyst. These characteristics all build on each other and help you build a reputation as a reliable, skillful person who can deliver business value. People will seek you as the analyst to solve their problems. Yes – it’s great if you write some SQL, python, or R, but these soft skills will allow you to be 10x greater than someone much stronger technically. After all, I truly believe that success as an analyst should be measured by is how they enable the people around them. A great analyst doesn’t 10x themselves; they 2x (or more!) everyone around them.
—-
1This is REALLY HARD to do in a remote environment. No idea how to replicate this digitally but I’m sure there is a way…
Do you enjoy working with data in your current role? Are you interested in a Data Analytics career? Are you currently a Data Analyst?
Good news! This weekly series is for you. It’ll cover all sorts of topics within analytics, including advice for aspiring analysts, best practices, key skills/tools and industry updates.
Initial blog topics include:
The Many Wandering Paths to Analytics
Analytics Job/Role Types
Key Skill Sets for Analysts
Visualization Best Practices
Measuring Success of Analysts
How to Prioritize Your Work Backlog
…and more!
Much of this will be written from my perspective as an Analyst. There are other perspectives out there for unique positions like Data Scientists and Data Engineering, and while I’ll touch on those regularly (and will write an entire post on the difference between those roles), the focus here will be Data Analysts.