Analysis & Narrative Written by Jacob Matson & Matt Levine, February 2024. [pdf]
Executive Summary
- The variant of “Super Bowl Squares” that we analyzed is one in which the entrant is assigned a digit (0-9) for Team A’s final score to end with and a digit for Team B’s final score to end with 1
- We compiled the final game scores from the 30 most recent NFL seasons to determine the frequency that each of the 100 potential “Squares” has been scored a winner
- We then compared these frequencies with the publicly available betting odds offered on the ‘Super Bowl Squares – Final Result’ market by DraftKings Sportsbook to ascertain the expected value (EV) of each square
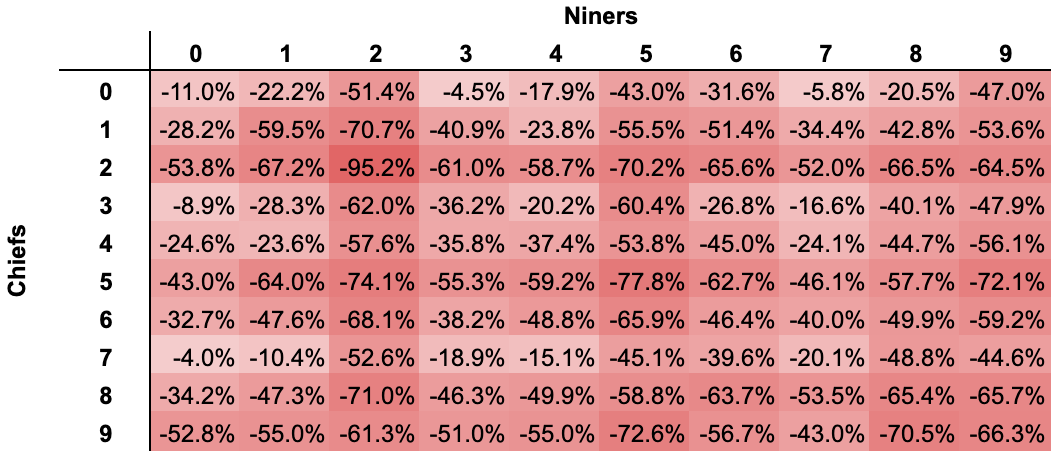
- The analysis determined that all 100 of the available squares carried a negative expected value ranging from [-4.0% to -95.2%], and that buying all 100 squares would carry a negative expected value of approximately [-39.7%]
Our Methodology
- We collected final game scores data from Pro Football Reference for the last 30 full NFL seasons, as well as the current NFL season through the completion of Week 17. We also included all Super Bowl games that took place prior to 30 seasons ago
- Games that ended in a tie were excluded since that is not a potential outcome for the Super Bowl
- We calculated raw frequencies for each of the 100 available squares, and then weighted the Niners’ digit 55% to the digit represented by the winner of the historical games, and 45% to the digit represented by the loser of the historical games. The [55% / 45%] weighting is reflective of the estimated win probability implied by the de-vigged Pinnacle Super Bowl Winner odds of ‘-129 / +117’ 2 3
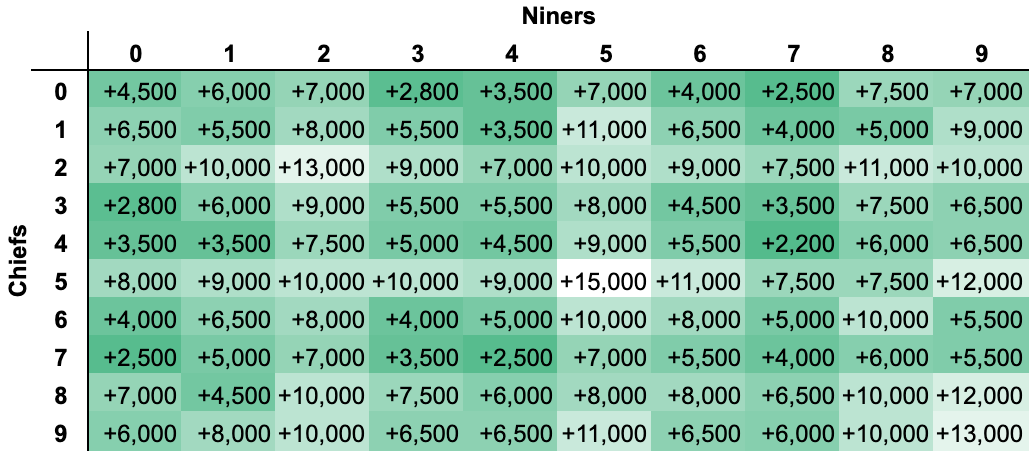
- The weighted frequencies were then multiplied by the gross payouts implied by DraftKings Sportsbook Super Bowl Squares – Final Result odds 2
Findings & Results
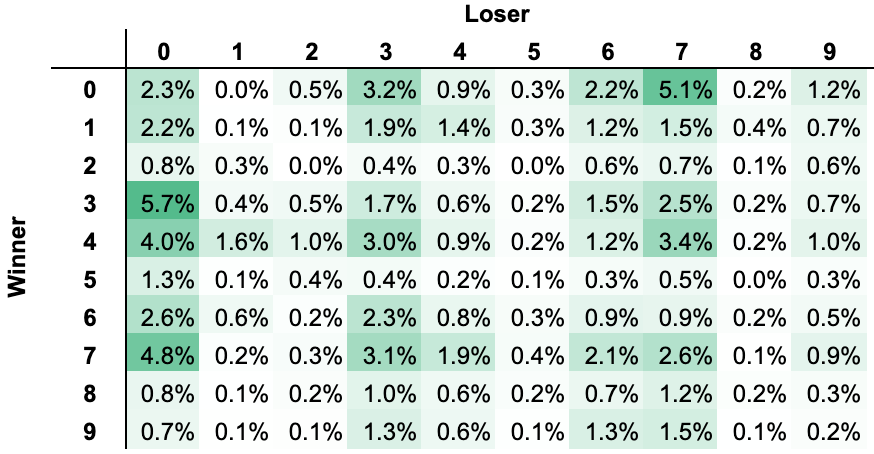
Raw Frequencies
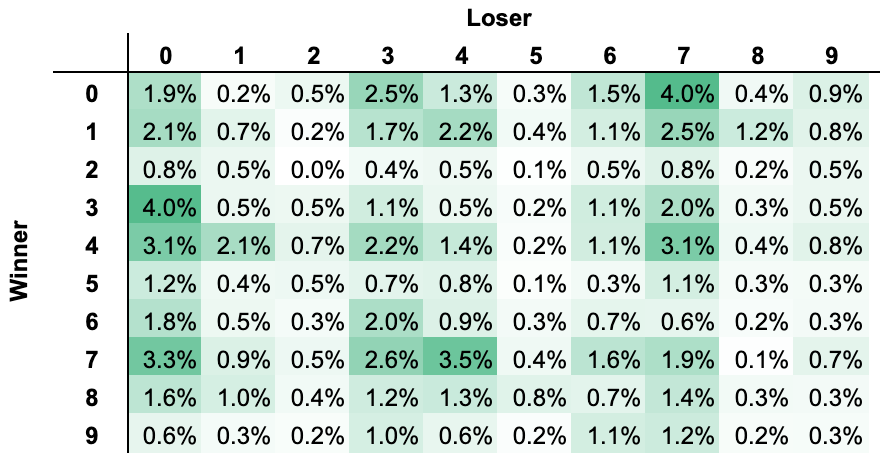
Sample Size: n = 8,162 games
- Most frequent digit for losing team is ‘0’, occurring ~20.5% of the time
- Most frequent digit for winning team is ‘7’, occurring ~15.5% of the time
| Losing Digit | Winning Digit | Frequency |
| 7 | 0 | 3.99% |
| 0 | 3 | 3.97% |
| 4 | 7 | 3.47% |
| 0 | 7 | 3.32% |
| 0 | 4 | 3.11% |
Weighted Frequencies
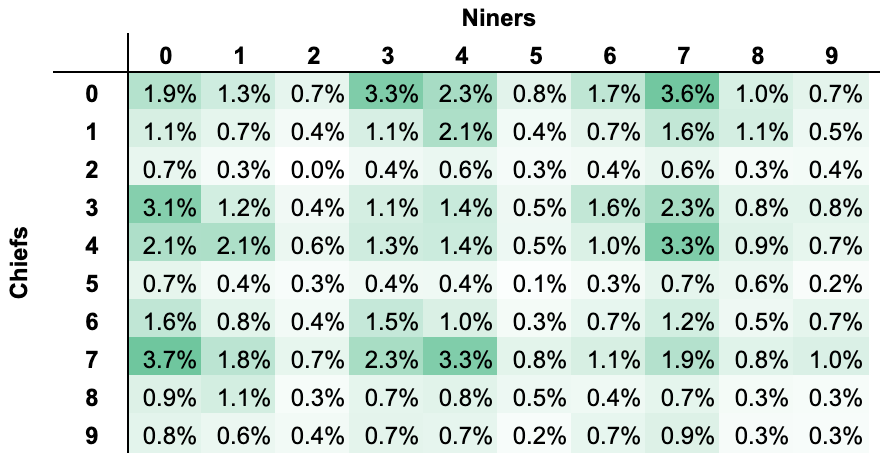
Sample Size: n = 8,162 games
- Most frequent digit for Niners is ‘7’, occurring ~16.9% of the time
- Most frequent digit for Chiefs is ‘0’, occurring ~17.4% of the time
| Niners Digit | Chiefs Digit | Frequency |
| 0 | 7 | 3.69% |
| 7 | 0 | 3.62% |
| 7 | 4 | 3.30% |
| 3 | 0 | 3.29% |
| 4 | 7 | 3.27% |
Expected Value by Square5
| Niners Digit | Chiefs Digit | Expected Value6 |
| 0 | 7 | (4.04%) |
| 3 | 0 | (4.55%) |
| 7 | 0 | (5.79%) |
| Niners Digit | Chiefs Digit | Expected Value |
| 2 | 2 | (95.19%) |
| 5 | 5 | (77.80%) |
| 2 | 5 | (74.08%) |
Raw Frequencies for Total Points u47.5
Sample Size: n = 5,127 games
- Most frequent digit for losing team is ‘0’, occurring ~25.2% of the time
- Most frequent digit for winning team is ‘4’, occurring ~16.3% of the time
| Loser Digit | Winner Digit | Frequency |
| 0 | 3 | 5.68% |
| 7 | 0 | 5.09% |
| 0 | 7 | 4.76% |
| 0 | 4 | 3.98% |
| 7 | 4 | 3.39% |
Raw Frequencies for Total Points o47.5
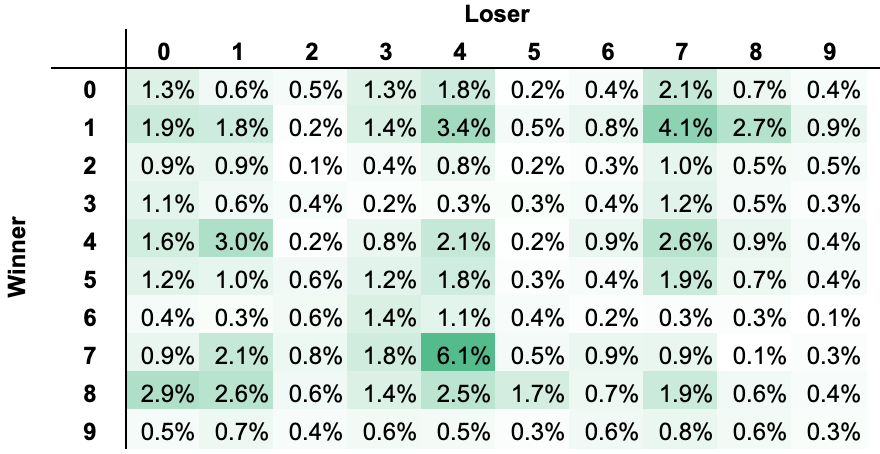
Sample Size: n = 3,035 games
- Most frequent digit for losing team is ‘4’, occurring ~20.5% of the time
- Most frequent digit for winning team is ‘1’, occurring ~17.9% of the time
| Loser Digit | Winner Digit | Frequency |
| 4 | 7 | 6.10% |
| 7 | 1 | 4.09% |
| 4 | 1 | 3.39% |
| 1 | 4 | 2.97% |
| 0 | 8 | 2.93% |
Selected Conclusions
- Participating in the “Super Bowl Squares – Final Result” market on DraftKings Sportsbook has a substantially negative overall expected value, and likely has a negative expected value for every single one of the 100 available squares
- This conclusion is logically continuous with the fact that the probabilities implied by DraftKings’ available odds sum to a total of ~165.9%; the market has substantial “juice” or “vig” overall
- The available odds on relatively common squares (e.g., [0:7], [3:0], [7:0]) are much closer to “fair” vs. the rarest square outcomes (e.g., [2:2], [5:5], [2:5])
- This strategy by DraftKings entices bettors to place a substantial dollar volume of wagers on the “almost fair” squares that have a reasonable chance of winning
- Secondarily, it mitigates the negative financial impact to DraftKings that could arise in the event of a “black swan” final game score, such as [15 – 5] or [22 – 12]
- A participant who has a bias towards a “high-scoring” vs. “low-scoring” game would place materially different value on certain square outcomes. Amongst the most pronouncedly:
- If one believes the game will be “low-scoring”, he should greatly value the losing team’s digit ‘0’, which occurs in 25.2% of low-scoring games in the dataset, but only in 12.7% of high-scoring games in the dataset
- If one believes the game will be “high-scoring”, he should greatly value the winning team’s digit ‘1’, which occurs in 17.9% of high-scoring games in the dataset, but only in 9.8% of low-scoring games in the dataset
Areas for Research Expansion
- The most substantial limitation in our analysis is that the square frequencies are derived solely from historical game logs, as opposed to a Monte Carlo simulation model of this year’s Super Bowl matchup
- As such, an analyst of this data is forced to balance (i) choosing the subset of games that are most comparable to the game being predicted, and (ii) leaving a sufficiently large number of games in the dataset to mitigate the impact of outlier game results
- The variant of Super Bowl Squares that we analyzed (“Final Result”) is one of several commonly played variants, each of which has its quirks that would impact the analysis. Perhaps the most common is the variant in which winning squares are determined by the digits in the score at the end of ANY quarter (as opposed to only at the end of the game)
- Further analysis could yield interesting insights regarding how the value of a given square changes as the game progresses. As an example, say that a team scores a safety (worth two points) in the 1st quarter of the game. Which final square results would see the greatest increase in estimated probability? Which would see the greatest decrease? Are there any squares that would only be minimally impacted?
- See ‘Appendix A’ for elaboration on the winning criteria for this variant. ↩︎
- Pinnacle Super Bowl Winner odds and DraftKings Sportsbook Super Bowl Squares – Final Result odds were both updated as of approximately 9 PM EST on February 9, 2024. ↩︎
- See ‘Appendix B’ for elaboration on the benefit and detailed methodology of weighting the raw square values relative to win probability. ↩︎
- Pinnacle Super Bowl Winner odds and DraftKings Sportsbook Super Bowl Squares – Final Result odds were both updated as of approximately 9 PM EST on February 9, 2024. ↩︎
- See ‘Appendix C’ for the DraftKings Sportsbook odds that were applied to each square in order to calculate expected value. Odds were updated as of approximately 9 PM EST on February 9, 2024. ↩︎
- Parentheses reflect negative values. For example, “(5.42%)” would reflect a negative expected value of 5.42%. ↩︎
Appendix A: Winning Criteria
- The variant of “Super Bowl Squares” that we analyzed is settled based on the final digit of each team’s score once the game has been completed
- Both teams’ digits must match for a square to be deemed a winner. As such, there are 100 potential outcomes, and there will always be exactly 1 victorious square out of these 100 potential outcomes.
- A partial set of the final scores that would result in victory for an entrant with the square “Chiefs 7 – Niners 3” are as follows:
| Chiefs 7 / Niners 3 | Chiefs 7 / Niners 13 | Chiefs 7 / Niners 23 | Chiefs 7 / Niners 33 |
| Chiefs 17 / Niners 3 | Chiefs 17 / Niners 13 | Chiefs 17 / Niners 23 | Chiefs 17 / Niners 33 |
| Chiefs 27 / Niners 3 | Chiefs 27 / Niners 13 | Chiefs 27 / Niners 23 | Chiefs 27 / Niners 33 |
Appendix B: Weighted Square Value
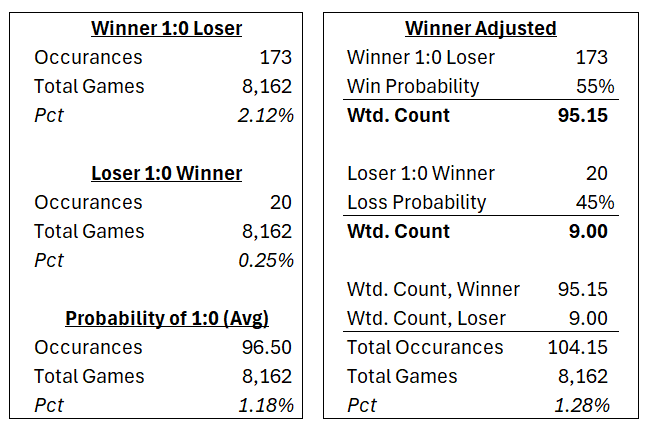
Weighting is reflective of the estimated win probability implied by the de-vigged Pinnacle Super Bowl Winner odds of ‘-129 / +117’ [55% / 45% ]
Key Insight: If the winner is known, the square “Winner 1:0 Loser” increases from 1.2% to 2.2% probability, roughly doubling.